1、Logstash 介绍
![图片[1]-Logstash 过滤-李佳程的个人主页](http://www.lijiach.com/wp-content/uploads/2023/01/image-73.png)
Logstash 是免费且开放的服务器端数据处理管道,能够从多个来源采集数据,转换数据,然后将数据发送到您最喜欢的“存储库”中
Logstash 可以水平伸缩,而且logstash是整个ELK中拥有最多插件的一个组件
Losgtash 基于 Ruby 语言开发
![图片[2]-Logstash 过滤-李佳程的个人主页](http://www.lijiach.com/wp-content/uploads/2023/01/image-74.png)
Logstash 主要功能:
- 输入 Input:用于日志收集,常见插件:Stdin、File、Kafka、Redis、Filebeat、Http
- 过滤 Filter:日志过滤和转换,常用插件:grok、date、geoip、mutate、useragent
- 输出 Output:将过滤转换过的日志输出,常见插件:File,Stdout,Elasticsearch,MySQL,Redis,Kafka
https://www.elastic.co/cn/logstash/
https://www.elastic.co/cn/downloads/logstash
https://www.elastic.co/cn/downloads/past-releases#logstash
2、Logstash 安装
2.1、环境准备安装 Java 环境
root@logstash01:~# apt install -y openjdk-11-jdk
2.2、安装 Logstash
注意: Logstash 版本要和 Elasticsearch 相同的版本,否则可能会出错
https://mirrors.tuna.tsinghua.edu.cn/elasticstack/7.xroot@logstash01:~# wget https://mirrors.tuna.tsinghua.edu.cn/elasticstack/7.x/apt/pool/main/l/logstash/logstash-7.17.8-amd64.deb
root@logstash01:~# dpkg -i logstash-7.17.8-amd64.deb
2.3、修改 Logstash 配置
root@logstash01:~# vim /etc/logstash/logstash.yml
node.name: logstash-node01
pipeline.workers: 2
pipeline.batch.size: 1000    #批量写入的消息个数,可以根据ES的性能做性能优化
pipeline.batch.delay: 5      #批量写入的延时,可以根据ES的性能做性能优化
path.data: /var/lib/logstash #默认值
path.logs: /var/log/logstash #默认值

# 内存优化
root@logstash01:~# vim /etc/logstash/jvm.options
-Xms1g
-Xmx1g

# Logstash默认以logstash用户运行,如果logstash需要收集本机的日志,可能会有权限问题,可以修改为root
root@logstash01:~# vim /etc/systemd/system/logstash.service
[Service]
User=root
Group=root

root@logstash01:~# systemctl daemon-reload
root@logstash01:~# systemctl enable --now logstash.service
3、Logstash 命令
# 配置环境变量
root@logstash01:~# vim /etc/profile.d/logstash.sh
export PATH=/usr/share/logstash/bin/:$PATH

root@logstash01:~# . /etc/profile.d/logstash.sh
https://www.elastic.co/guide/en/logstash/current/first-event.html
# 各种插件
https://www.elastic.co/guide/en/logstash/7.6/input-plugins.html
https://www.elastic.co/guide/en/logstash/7.6/filter-plugins.html
https://www.elastic.co/guide/en/logstash/7.6/output-plugins.html
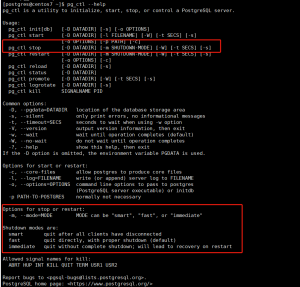
# 常用选项
-e 指定配置内容
-f 指定配置文件
-t 语法检查
-r 修改配置文件,自动加载生效
# 各种插件帮助
https://www.elastic.co/guide/en/logstash/current/index.html
![图片[3]-Logstash 过滤-李佳程的个人主页](http://www.lijiach.com/wp-content/uploads/2023/01/image-75.png)
范例:列出所有插件
root@logstash01:~# /usr/share/logstash/bin/logstash-plugin list
Github logstash插件链接
https://github.com/logstash-plugin![图片[4]-Logstash 过滤-李佳程的个人主页](http://www.lijiach.com/wp-content/uploads/2023/01/image-76.png)
4、Logstash 输入 Input 插件
https://www.elastic.co/guide/en/logstash/7.6/input-plugins.html4.1、标准输入
范例:交互式实现
# 标准输入和输出,codec => rubydebug指输出格式,是默认值,可以省略
root@logstash01:~# /usr/share/logstash/bin/logstash -e 'input { stdin{} } output { stdout{ codec => rubydebug }}'

Using bundled JDK: /usr/share/logstash/jdk
OpenJDK 64-Bit Server VM warning: Option UseConcMarkSweepGC was deprecated in version 9.0 and will likely be removed in a future release.
WARNING: Could not find logstash.yml which is typically located in $LS_HOME/config or /etc/logstash. You can specify the path using --path.settings. Continuing using the defaults
Could not find log4j2 configuration at path /usr/share/logstash/config/log4j2.properties. Using default config which logs errors to the console
[INFO ] 2023-01-04 01:35:13.009 [main] runner - Starting Logstash {"logstash.version"=>"7.17.8", "jruby.version"=>"jruby 9.2.20.1 (2.5.8) 2021-11-30 2a2962fbd1 OpenJDK 64-Bit Server VM 11.0.17+8 on 11.0.17+8 +indy +jit [linux-x86_64]"}
[INFO ] 2023-01-04 01:35:13.022 [main] runner - JVM bootstrap flags: [-Xms1g, -Xmx1g, -XX:+UseConcMarkSweepGC, -XX:CMSInitiatingOccupancyFraction=75, -XX:+UseCMSInitiatingOccupancyOnly, -Djava.awt.headless=true, -Dfile.encoding=UTF-8, -Djdk.io.File.enableADS=true, -Djruby.compile.invokedynamic=true, -Djruby.jit.threshold=0, -Djruby.regexp.interruptible=true, -XX:+HeapDumpOnOutOfMemoryError, -Djava.security.egd=file:/dev/urandom, -Dlog4j2.isThreadContextMapInheritable=true]
[INFO ] 2023-01-04 01:35:13.113 [main] settings - Creating directory {:setting=>"path.queue", :path=>"/usr/share/logstash/data/queue"}
[INFO ] 2023-01-04 01:35:13.138 [main] settings - Creating directory {:setting=>"path.dead_letter_queue", :path=>"/usr/share/logstash/data/dead_letter_queue"}
[WARN ] 2023-01-04 01:35:13.471 [LogStash::Runner] multilocal - Ignoring the 'pipelines.yml' file because modules or command line options are specified
[INFO ] 2023-01-04 01:35:13.515 [LogStash::Runner] agent - No persistent UUID file found. Generating new UUID {:uuid=>"bb1b73b3-3186-4151-a0c9-e0ebe8f06773", :path=>"/usr/share/logstash/data/uuid"}
[INFO ] 2023-01-04 01:35:15.157 [Api Webserver] agent - Successfully started Logstash API endpoint {:port=>9600, :ssl_enabled=>false}
[INFO ] 2023-01-04 01:35:16.295 [Converge PipelineAction::Create<main>] Reflections - Reflections took 99 ms to scan 1 urls, producing 119 keys and 419 values
[WARN ] 2023-01-04 01:35:17.063 [Converge PipelineAction::Create<main>] line - Relying on default value of `pipeline.ecs_compatibility`, which may change in a future major release of Logstash. To avoid unexpected changes when upgrading Logstash, please explicitly declare your desired ECS Compatibility mode.
[WARN ] 2023-01-04 01:35:17.097 [Converge PipelineAction::Create<main>] stdin - Relying on default value of `pipeline.ecs_compatibility`, which may change in a future major release of Logstash. To avoid unexpected changes when upgrading Logstash, please explicitly declare your desired ECS Compatibility mode.
[INFO ] 2023-01-04 01:35:17.493 [[main]-pipeline-manager] javapipeline - Starting pipeline {:pipeline_id=>"main", "pipeline.workers"=>2, "pipeline.batch.size"=>125, "pipeline.batch.delay"=>50, "pipeline.max_inflight"=>250, "pipeline.sources"=>["config string"], :thread=>"#<Thread:0x731e7f0a run>"}
[INFO ] 2023-01-04 01:35:18.617 [[main]-pipeline-manager] javapipeline - Pipeline Java execution initialization time {"seconds"=>1.12}
WARNING: An illegal reflective access operation has occurred
WARNING: Illegal reflective access by com.jrubystdinchannel.StdinChannelLibrary$Reader (file:/usr/share/logstash/vendor/bundle/jruby/2.5.0/gems/jruby-stdin-channel-0.2.0-java/lib/jruby_stdin_channel/jruby_stdin_channel.jar) to field java.io.FilterInputStream.in
WARNING: Please consider reporting this to the maintainers of com.jrubystdinchannel.StdinChannelLibrary$Reader
WARNING: Use --illegal-access=warn to enable warnings of further illegal reflective access operations
WARNING: All illegal access operations will be denied in a future release
[INFO ] 2023-01-04 01:35:18.715 [[main]-pipeline-manager] javapipeline - Pipeline started {"pipeline.id"=>"main"}
The stdin plugin is now waiting for input:
[INFO ] 2023-01-04 01:35:18.818 [Agent thread] agent - Pipelines running {:count=>1, :running_pipelines=>[:main], :non_running_pipelines=>[]}
hello world
{
    "@timestamp" => 2023-01-04T01:35:42.475Z,  #当前事件的发生时间
          "host" => "logstash01.test.com",     #标记事件发生在哪里
       "message" => "hello world",             #消息的具体内容
      "@version" => "1"          #事件版本号,一个事件就是一个ruby对象
}

# 后续还可继续输入其它信息,按ctrl+c退出
# 指定输入信息为Json格式
root@logstash01:~# /usr/share/logstash/bin/logstash -e 'input { stdin{ codec => json } } output { stdout{ codec => rubydebug }}'
......
 { "name":"ljc","age": "18"}
{
          "name" => "ljc",
           "age" => "18",
    "@timestamp" => 2023-01-04T01:38:59.918Z,
      "@version" => "1",
          "host" => "logstash01.test.com"
}
范例:以配置文件实现
root@logstash01:~# vim /etc/logstash/conf.d/stdin_to_stdout.conf
input {
   stdin {
       type => "stdin_type"      #自定义事件类型,可用于后续判断
       tags => "stdin_tag"       #自定义事件tag,可用于后续判断
       codec => "json"           #指定Json 格式

   }
}
output {
   stdout {
       codec => "rubydebug" #输出格式,此为默认值,可省略
   }
}

# 语法检查
root@logstash01:~# logstash -f /etc/logstash/conf.d/stdin_to_stdout.conf -t
......
Configuration OK
[INFO ] 2023-01-04 01:44:38.104 [LogStash::Runner] runner - Using config.test_and_exit mode. Config Validation Result: OK. Exiting Logstash

# 执行logstash
root@logstash01:~# logstash -f /etc/logstash/conf.d/stdin_to_stdout.conf
......
hello,lijiacheng
[WARN ] 2023-01-04 01:45:33.465 [[main]<stdin] jsonlines - JSON parse error, original data now in message field {:message=>"Unrecognized token 'hello': was expecting ('true', 'false' or 'null')\n at [Source: (String)\"hello,lijiacheng\"; line: 1, column: 6]", :exception=>LogStash::Json::ParserError, :data=>"hello,lijiacheng"}
{
          "type" => "stdin_type",
       "message" => "hello,lijiacheng",
          "host" => "logstash01.test.com",
    "@timestamp" => 2023-01-04T01:45:33.489Z,
      "@version" => "1",
          "tags" => [
        [0] "_jsonparsefailure",
        [1] "stdin_tag"
    ]
}

hello,logstash
[WARN ] 2023-01-04 01:46:03.199 [[main]<stdin] jsonlines - JSON parse error, original data now in message field {:message=>"Unrecognized token 'hello': was expecting ('true', 'false' or 'null')\n at [Source: (String)\"hello,logstash\"; line: 1, column: 6]", :exception=>LogStash::Json::ParserError, :data=>"hello,logstash"}
{
          "type" => "stdin_type",
       "message" => "hello,logstash",
          "host" => "logstash01.test.com",
    "@timestamp" => 2023-01-04T01:46:03.200Z,
      "@version" => "1",
          "tags" => [
        [0] "_jsonparsefailure",
        [1] "stdin_tag"
    ]
}

 { "name":"ljc","age": "18"}
{
           "age" => "18",
          "type" => "stdin_type",
          "name" => "ljc",
          "host" => "logstash01.test.com",
    "@timestamp" => 2023-01-04T01:46:46.683Z,
      "@version" => "1",
          "tags" => [
        [0] "stdin_tag"
    ]
}
4.2、从文件输入
Logstash 会记录每个文件的读取位置,下次自动从此位置继续向后读取
每个文件的读取位置记录在 /var/lib/logsstash/plugins/inputs/files/.sincedb_xxxx对应的文件中
此文件包括文件的 inode号,大小等信息
范例:
root@logstash01:~# vim /etc/logstash/conf.d/file_to_stdout.conf
input {
   file {
       path => "/tmp/wang.*"
       type => "wanglog"             #添加自定义的type字段,可以用于条件判断
       exclude => "*.txt"            #排除不想采集数据的文件,基于通配符glob匹配语法
       start_position => "beginning" #第一次丛头开始读取文件,可以取值为:beginning和
end
       stat_interval => "3"  #定时检查文件是否更新,默认1s
       codec => json                 #如果文件是Json格式,需要指定此项才能解析,如果不是Json格式,却添加此行也不会影响结果
   }
   file {
   path => "/var/log/syslog"
   type => "syslog"
   start_position => "beginning"
   stat_interval => "3"
   }
}
output {
   stdout {
       codec => rubydebug
   }
}

root@logstash01:~# logstash -f /etc/logstash/conf.d/file_to_stdout.conf -t

root@logstash01:~# echo line1 >> /tmp/test.log

root@logstash01:~# logstash -f /etc/logstash/conf.d/file_to_stdout.conf
{
      "@version" => "1",
          "path" => "/tmp/test.log",
          "type" => "testlog",
       "message" => "line1",
          "tags" => [
        [0] "_jsonparsefailure"
    ],
    "@timestamp" => 2023-01-04T01:54:15.144Z,
          "host" => "logstash01.test.com"
}

root@logstash01:~# echo line2 >> /tmp/test.log

{
      "@version" => "1",
          "path" => "/tmp/test.log",
          "type" => "testlog",
       "message" => "line2",
          "tags" => [
        [0] "_jsonparsefailure"
    ],
    "@timestamp" => 2023-01-04T01:54:27.151Z,
          "host" => "logstash01.test.com"
}
logstash利用 sincedb 文件记录了logstash收集的记录文件的信息,比如位置,以方便下次接着从此位置继续收集日志
root@logstash01:~# cat /var/lib/logstash/plugins/inputs/file/.sincedb_4188f728070d4ab63807bb3525fa05c4
143 0 64768 24 1672797265.2522361 /tmp/test.log
# 记录了收集文件的inode和大小等信息
root@logstash01:~# ll -li /tmp/test.log
143 -rw-r--r-- 1 root root 24 Jan  4 01:54 /tmp/test.log
4.3、从 Http 请求买取数据
root@logstash01:~# vim /etc/logstash/conf.d/http_to_stdout.conf
input {
   http {
       port =>6666
       codec => json
   }
}
output {
   stdout {
       codec => rubydebug
   }
}

root@logstash01:~# logstash -f /etc/logstash/conf.d/http_to_stdout.conf -t

root@logstash01:~# logstash -f /etc/logstash/conf.d/http_to_stdout.conf -r
{
      "@version" => "1",
    "@timestamp" => 2023-01-04T02:53:32.321Z,
          "host" => "192.168.1.105",
       "message" => "",
       "headers" => {
           "request_path" => "/",
            "http_accept" => "*/*",
              "http_host" => "192.168.1.108:6666",
         "content_length" => "0",
         "request_method" => "GET",
        "http_user_agent" => "curl/7.68.0",
           "http_version" => "HTTP/1.1"
    },
          "tags" => [
        [0] "_grokparsefailure"
    ]
}
{
      "@version" => "1",
    "@timestamp" => 2023-01-04T02:54:12.139Z,
          "host" => "192.168.1.105",
       "message" => "test log message",
       "headers" => {
           "request_path" => "/",
            "http_accept" => "*/*",
              "http_host" => "192.168.1.108:6666",
         "content_length" => "16",
         "request_method" => "POST",
           "content_type" => "application/x-www-form-urlencoded",
        "http_user_agent" => "curl/7.68.0",
           "http_version" => "HTTP/1.1"
    },
          "tags" => [
        [0] "_grokparsefailure"
    ]
}

# 执行下面访问可以看到上面信息
root@web01:~# curl http://192.168.1.108:6666
ok
root@web01:~# curl -XPOST -d'test log message' http://192.168.1.108:6666
ok
4.4、从 Filebeat 读取数据
root@web01:~# vim /etc/filebeat/filebeat.yml

output.logstash:
  # The Logstash hosts
  hosts: ["192.168.1.108:5044"]

root@web01:~# systemctl restart filebeat.service

root@logstash01:~# vim /etc/logstash/conf.d/filebeat_to_stdout.conf
input {
   beats {
       port => 5044
   }
}
output {
   stdout {
       codec => rubydebug
   }
}

root@logstash01:~# logstash -f /etc/logstash/conf.d/filebeat_to_stdout.conf -t

root@logstash01:~# logstash -f /etc/logstash/conf.d/filebeat_to_stdout.conf
{
                "ecs" => {
        "version" => "1.12.0"
    },
       "responsetime" => 0,
            "tcp_xff" => "-",
               "tags" => [
        [0] "nginx-access",
        [1] "beats_input_raw_event"
    ],
             "domain" => "192.168.1.105",
           "clientip" => "192.168.1.108",
               "size" => 12,
               "host" => {
                   "id" => "9eaba3e85c9a4e16b66cda021bc16221",
                   "os" => {
             "version" => "20.04.5 LTS (Focal Fossa)",
            "codename" => "focal",
                "type" => "linux",
            "platform" => "ubuntu",
                "name" => "Ubuntu",
              "family" => "debian",
              "kernel" => "5.4.0-131-generic"
        },
             "hostname" => "web01.test.com",
                 "name" => "web01.test.com",
        "containerized" => false,
                   "ip" => [
            [0] "192.168.1.105",
            [1] "fe80::20c:29ff:fe6c:ce9f"
        ],
         "architecture" => "x86_64",
                  "mac" => [
            [0] "00:0c:29:6c:ce:9f"
        ]
    },
             "status" => "200",
              "agent" => {
                  "id" => "2fe34205-12d8-4f37-a3f5-39e0d42f73e6",
             "version" => "7.17.8",
                "type" => "filebeat",
                "name" => "web01.test.com",
            "hostname" => "web01.test.com",
        "ephemeral_id" => "71304619-c65a-447f-b9dc-c0cd4b67c0b8"
    },
       "upstreamtime" => "-",
            "referer" => "-",
                "uri" => "/index.html",
       "upstreamhost" => "-",
    "http_user_agent" => "curl/7.68.0",
                "log" => {
        "offset" => 426307,
          "file" => {
            "path" => "/var/log/nginx/access_json.log"
        }
    },
           "@version" => "1",
              "input" => {
        "type" => "log"
    },
          "http_host" => "192.168.1.105",
         "@timestamp" => 2023-01-04T02:17:30.000Z,
                "xff" => "-"
}

# 执行下面访问可以看到上面信息
root@logstash01:~# curl http://192.168.1.105
4.5、从 Redis 中读取数据
支持由多个 Logstash 从 Redis 读取日志,提高性能
Logstash 从 Redis 收集完数据后,将删除对应的列表Key
input {
  redis {
    host => 'Redis_IP'
    port => "6379"
    password => "123456"
    db => "0"
    data_type => 'list'
    key => "nginx-accesslog"
  }
}
output {
   stdout {
       codec => rubydebug
   }
}
4.6、从 Kafka 中读取数据
input {
   kafka {
       bootstrap_servers => "192.168.1.87:9092"
       group_id => "logstash"
       topics => ["nginx-accesslog","nginx-errorlog"]
       codec => "json"
       consumer_threads => 8
   }
}
output {
   stdout {
       codec => rubydebug
   }
}
© 版权声明
文章版权归作者所有,未经允许请勿转载。
THE END