![图片[1]-进程管理和性能相关工具1-李佳程的个人主页](http://www.lijiach.com/wp-content/uploads/2022/11/image-63.png)
- Linux系统状态的查看及管理工具:
- pstree
- ps
- pidof
- pgrep
- top
- htop
- glance
- pmap
- vmstat
- dstat
- kill
- pkill
- job
- bg
- fg
- nohup
1、进程树 pstree
pstree 可以用来显示进程的父子关系,以树形结构显示
来自于psmisc包
pstree   [OPTION] [ PID | USER ]

-p 显示PID
-T 不显示线程thread,默认显示线程
-u 显示用户切换
-H pid 高亮显示指定进程及其前辈进程
#范例
[root@centos79 ~]# pstree 1
systemd─┬─NetworkManager───2*[{NetworkManager}]
├─VGAuthService
├─auditd───{auditd}
├─crond
├─dbus-daemon
├─gssproxy───5*[{gssproxy}]
├─httpd───6*[httpd]
├─irqbalance
├─login───bash
├─lvmetad
├─master─┬─pickup
│ └─qmgr
├─polkitd───6*[{polkitd}]
├─rpcbind
├─rsyslogd───2*[{rsyslogd}]
├─sshd─┬─sshd───bash───pstree
│ └─sshd───sftp-server
├─systemd-journal
├─systemd-logind
├─systemd-udevd
├─tuned───4*[{tuned}]
└─vmtoolsd───2*[{vmtoolsd}]
[root@centos79 ~]# pstree -p
systemd(1)─┬─NetworkManager(763)─┬─{NetworkManager}(775)
│ └─{NetworkManager}(783)
├─VGAuthService(765)
├─auditd(729)───{auditd}(730)
├─crond(788)
├─dbus-daemon(758)
├─gssproxy(770)─┬─{gssproxy}(778)
│ ├─{gssproxy}(779)
│ ├─{gssproxy}(780)
│ ├─{gssproxy}(781)
│ └─{gssproxy}(782)
├─httpd(1035)─┬─httpd(1140)
│ ├─httpd(1141)
│ ├─httpd(1142)
│ ├─httpd(1143)
│ ├─httpd(1144)
│ └─httpd(3275)
├─irqbalance(757)
├─login(804)───bash(2503)
├─lvmetad(560)
├─master(1254)─┬─pickup(3318)
│ └─qmgr(1258)
├─polkitd(764)─┬─{polkitd}(771)
│ ├─{polkitd}(772)
│ ├─{polkitd}(777)
│ ├─{polkitd}(790)
│ ├─{polkitd}(791)
│ └─{polkitd}(796)
├─rpcbind(760)
├─rsyslogd(1037)─┬─{rsyslogd}(1057)
│ └─{rsyslogd}(1059)
├─sshd(1036)─┬─sshd(3230)───bash(3232)───pstree(3432)
│ └─sshd(3237)───sftp-server(3257)
├─systemd-journal(540)
├─systemd-logind(756)
├─systemd-udevd(565)
├─tuned(1033)─┬─{tuned}(1458)
│ ├─{tuned}(1459)
│ ├─{tuned}(1473)
│ └─{tuned}(1474)
└─vmtoolsd(766)─┬─{vmtoolsd}(799)
└─{vmtoolsd}(807)
[root@centos79 ~]# pstree -u
systemd─┬─NetworkManager───2*[{NetworkManager}]
├─VGAuthService
├─auditd───{auditd}
├─crond
├─dbus-daemon(dbus)
├─gssproxy───5*[{gssproxy}]
├─httpd───6*[httpd(apache)]
├─irqbalance
├─login───bash
├─lvmetad
├─master─┬─pickup(postfix)
│ └─qmgr(postfix)
├─polkitd(polkitd)───6*[{polkitd}]
├─rpcbind(rpc)
├─rsyslogd───2*[{rsyslogd}]
├─sshd─┬─sshd───bash───pstree
│ └─sshd───sftp-server
├─systemd-journal
├─systemd-logind
├─systemd-udevd
├─tuned───4*[{tuned}]
└─vmtoolsd───2*[{vmtoolsd}]![图片[2]-进程管理和性能相关工具1-李佳程的个人主页](http://www.lijiach.com/wp-content/uploads/2022/11/image-64.png)
2、进程信息 ps
ps 即 process state,可以进程当前状态的快照,默认显示当前终端中的进程,Linux系统各进程的相关信息均保存在/proc/PID目录下的各文件中。
ps [OPTION]...

UNIX选项 如: -A -e
GNU选项 如: --help
BSD选项 如: a
#选项
a              选项包括所有终端中的进程
x              选项包括不链接终端的进程
u              选项显示进程所有者的信息
f              选项显示进程树,相当于 --forest
k|--sort 属性   对属性排序,属性前加 - 表示倒序
o 属性…        选项显示定制的信息 pid、cmd、%cpu、%mem
L               显示支持的属性列表
-C cmdlist      指定命令,多个命令用,分隔
-L              显示线程
-e              显示所有进程,相当于-A
-f              显示完整格式程序信息
-F              显示更完整格式的进程信息
-H              以进程层级格式显示进程相关信息
-u userlist     指定有效的用户ID或名称
-U userlist     指定真正的用户ID或名称
-g gid或groupname   指定有效的gid或组名称
-G gid或groupname   指定真正的gid或组名称
-p pid              显示指pid的进程
--ppid pid          显示属于pid的子进程
-t ttylist          指定tty,相当于 t
-M                  显示SELinux信息,相当于Z
#ps 输出属性
C :  ps -ef 显示列 C 表示cpu利用率
VSZ: Virtual memory SiZe,虚拟内存集,线性内存
RSS: ReSident Size, 常驻内存集
STAT:进程状态
   R:running
   S: interruptable sleeping
   D: uninterruptable sleeping
   T: stopped
   Z: zombie
   +: 前台进程
   l: 多线程进程
   L:内存分页并带锁
   N:低优先级进程
   <: 高优先级进程
   s: session leader,会话(子进程)发起者
   I:Idle kernel thread,CentOS 8 新特性
ni: nice值
pri: priority 优先级
rtprio: 实时优先级
psr: processor CPU编号
#常用组合
aux
-ef
-eFH
-eo pid,tid,class,rtprio,ni,pri,psr,pcpu,stat,comm
 axo stat,euid,ruid,tty,tpgid,sess,pgrp,ppid,pid,pcpu,comm
#范例
# 列 C 表示 CPU利用率
[root@centos79 ~]# ps -ef
UID PID PPID C STIME TTY TIME CMD
root 1 0 0 Nov12 ? 00:00:02 /usr/lib/systemd/systemd --switched-root --system --deserialize 22
root 2 0 0 Nov12 ? 00:00:00 [kthreadd]
root 4 2 0 Nov12 ? 00:00:00 [kworker/0:0H]
root 5 2 0 Nov12 ? 00:00:00 [kworker/u256:0]
root 6 2 0 Nov12 ? 00:00:00 [ksoftirqd/0]
root 7 2 0 Nov12 ? 00:00:00 [migration/0]
[root@centos79 ~]# ps aux
USER PID %CPU %MEM VSZ RSS TTY STAT START TIME COMMAND
root 1 0.0 0.1 125640 4132 ? Ss Nov12 0:02 /usr/lib/systemd/systemd --switched-root --system --deserial
root 2 0.0 0.0 0 0 ? S Nov12 0:00 [kthreadd]
root 4 0.0 0.0 0 0 ? S< Nov12 0:00 [kworker/0:0H]
root 5 0.0 0.0 0 0 ? S Nov12 0:00 [kworker/u256:0]
root 6 0.0 0.0 0 0 ? S Nov12 0:00 [ksoftirqd/0]
root 7 0.0 0.0 0 0 ? S Nov12 0:00 [migration/0]
root 8 0.0 0.0 0 0 ? S Nov12 0:00 [rcu_bh]
root 9 0.0 0.0 0 0 ? S Nov12 0:00 [rcu_sched]#查看进程的父子关系
[root@centos79 ~]# ps auxf
USER PID %CPU %MEM VSZ RSS TTY STAT START TIME COMMAND
root 2 0.0 0.0 0 0 ? S Nov12 0:00 [kthreadd]
root 4 0.0 0.0 0 0 ? S< Nov12 0:00 \_ [kworker/0:0H]
root 5 0.0 0.0 0 0 ? S Nov12 0:00 \_ [kworker/u256:0]
root 6 0.0 0.0 0 0 ? S Nov12 0:00 \_ [ksoftirqd/0]
root 7 0.0 0.0 0 0 ? S Nov12 0:00 \_ [migration/0]
root 8 0.0 0.0 0 0 ? S Nov12 0:00 \_ [rcu_bh]
root 9 0.0 0.0 0 0 ? S Nov12 0:00 \_ [rcu_sched]
root 10 0.0 0.0 0 0 ? S< Nov12 0:00 \_ [lru-add-drain]
#查看进程的特定属性
[root@centos79 ~]# ps axo pid,cmd,%mem,%cpu
PID CMD %MEM %CPU
1 /usr/lib/systemd/systemd -- 0.1 0.0
2 [kthreadd] 0.0 0.0
4 [kworker/0:0H] 0.0 0.0
5 [kworker/u256:0] 0.0 0.0
6 [ksoftirqd/0] 0.0 0.0
7 [migration/0] 0.0 0.0
8 [rcu_bh] 0.0 0.0
9 [rcu_sched] 0.0 0.0
10 [lru-add-drain] 0.0 0.0
11 [watchdog/0] 0.0 0.0
12 [watchdog/1] 0.0 0.0
13 [migration/1] 0.0 0.0
14 [ksoftirqd/1] 0.0 0.0
15 [kworker/1:0] 0.0 0.0
16 [kworker/1:0H] 0.0 0.0
18 [kdevtmpfs] 0.0 0.0
19 [netns] 0.0 0.0
20 [khungtaskd] 0.0 0.0
21 [writeback] 0.0 0.0
22 [kintegrityd] 0.0 0.0
#按CPU利用率倒序排序
[root@centos79 ~]# ps aux k -%cpu
USER        PID %CPU %MEM    VSZ   RSS TTY      STAT START   TIME COMMAND
root          1  0.0  0.1 125640  4132 ?        Ss   Nov12   0:02 /usr/lib/systemd/systemd --switched-root --system --deserial
root          2  0.0  0.0      0     0 ?        S    Nov12   0:00 [kthreadd]
root          4  0.0  0.0      0     0 ?        S<   Nov12   0:00 [kworker/0:0H]
root          5  0.0  0.0      0     0 ?        S    Nov12   0:00 [kworker/u256:0]
root          6  0.0  0.0      0     0 ?        S    Nov12   0:00 [ksoftirqd/0]
root          7  0.0  0.0      0     0 ?        S    Nov12   0:00 [migration/0]
root          8  0.0  0.0      0     0 ?        S    Nov12   0:00 [rcu_bh]
root          9  0.0  0.0      0     0 ?        S    Nov12   0:00 [rcu_sched]
root         10  0.0  0.0      0     0 ?        S<   Nov12   0:00 [lru-add-drain]


[root@centos79 ~]# ps axo pid,cmd,%cpu,%mem k -%cpu
   PID CMD                         %CPU %MEM
     1 /usr/lib/systemd/systemd --  0.0  0.1
     2 [kthreadd]                   0.0  0.0
     4 [kworker/0:0H]               0.0  0.0
     5 [kworker/u256:0]             0.0  0.0
     6 [ksoftirqd/0]                0.0  0.0
     7 [migration/0]                0.0  0.0
     8 [rcu_bh]                     0.0  0.0
     9 [rcu_sched]                  0.0  0.0
    10 [lru-add-drain]              0.0  0.0

#按内存倒序排序
[root@centos79 ~]# ps axo pid,cmd,%cpu,%mem --sort %mem
   PID CMD                         %CPU %MEM
     2 [kthreadd]                   0.0  0.0
     4 [kworker/0:0H]               0.0  0.0
     5 [kworker/u256:0]             0.0  0.0
     6 [ksoftirqd/0]                0.0  0.0
     7 [migration/0]                0.0  0.0
     8 [rcu_bh]                     0.0  0.0
     9 [rcu_sched]                  0.0  0.0
    10 [lru-add-drain]              0.0  0.0
#范例
#查询你拥有的所有进程
ps -x

#显示指定用户名(RUID)或用户ID的进程
ps -fU apache
ps -fU 48

#显示指定用户名(EUID)或用户ID的进程
ps -fu wang
ps -fu 1000

#查看以root用户权限(实际和有效ID)运行的每个进程
ps -U root -u root

#列出某个组拥有的所有进程(实际组ID:RGID或名称)
ps -fG nginx

#列出有效组名称(或会话)所拥有的所有进程
ps -fg mysql
ps -fg 27

#显示指定的进程ID对应的进程
ps -fp 1234

#以父进程ID来显示其下所有的进程,如显示父进程为1234的所有进程
ps -f --ppid 1234

#显示指定PID的多个进程
ps -fp 1204,1239,1263

#要按tty显示所属进程
ps -ft pts/0

#以进程树显示系统中的进程如何相互链接
ps -e --forest

#以进程树显示指定的进程
ps -f --forest -C sshd
ps -ef --forest | grep -v grep | grep sshd

#要显示一个进程的所有线程,将显示LWP(轻量级进程)以及NLWP(轻量级进程数)列
ps -fL -C nginx

#要列出所有格式说明符
ps L

#查看进程的PID,PPID,用户名和命令
ps -eo pid,ppid,user,cmd

#自定义格式显示文件系统组,ni值开始时间和进程的时间
ps -p 1234 -o pid,ppid,fgroup,ni,lstart,etime

#使用其PID查找进程名称:
ps -p 1244 -o comm=

#要以其名称选择特定进程,显示其所有子进程
ps -C sshd,bash

#查找指定进程名所有的所属PID,在编写需要从std输出或文件读取PID的脚本时这个参数很有用
ps -C httpd,sshd -o pid=

#检查一个进程的执行时间
ps -eo comm,etime,user | grep nginx

#排序,查找占用最多内存和CPU的进程
ps -eo pid,ppid,cmd,%mem,%cpu --sort=-%mem | head
ps -eo pid,ppid,cmd,%mem,%cpu --sort=-%cpu | head

#显示安全信息
ps -eM
ps --context

#使用以下命令以用户定义的格式显示安全信息
ps -eo euser,ruser,suser,fuser,f,comm,label

#使用watch实用程序执行重复的输出以实现对就程进行实时的监视,如下面的命令显示每秒钟的监视
watch -n 1 'ps -eo pid,ppid,cmd,%mem,%cpu --sort=-%mem | head'

#找到未知进程的执行程序文件路径
ls -l /proc/1272/exe
/proc/1272/exe -> /usr/bin/bash

#查看优先级和CPU绑定关系
[root@centos79 ~]# ps axo pid,cmd,ni,pri,psr,rtprio |grep migration
     7 [migration/0]                 - 139   0     99
    13 [migration/1]                 - 139   1     99
  3487 grep --color=auto migration   0  19   0      -

[root@centos79 ~]# ps axo pid,cmd,ni,pri,psr |grep dd
     2 [kthreadd]                    0  19   0
    10 [lru-add-drain]             -20  39   0
    53 [ipv6_addrconf]             -20  39   1
  3489 grep --color=auto dd          0  19   0
#实现进程和CPU的绑定
[root@centos79 ~]# taskset --help
Usage: taskset [options] [mask | cpu-list] [pid|cmd [args...]]
Options:
-a, --all-tasks operate on all the tasks (threads) for a given pid
-p, --pid operate on existing given pid
-c, --cpu-list display and specify cpus in list format
-h, --help display this help
-V, --version output version information
The default behavior is to run a new command:
taskset 03 sshd -b 1024
You can retrieve the mask of an existing task:
taskset -p 700
Or set it:
taskset -p 03 700
List format uses a comma-separated list instead of a mask:
taskset -pc 0,3,7-11 700
Ranges in list format can take a stride argument:
e.g. 0-31:2 is equivalent to mask 0x55555555
For more information see taskset(1).
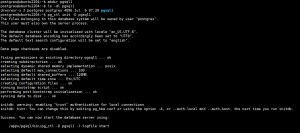
3、查看进程信息 prtstat
可以显示进程信息,来自于psmisc包
prtstat [options] PID ...

-r raw 格式显示
#范例
[root@centos79 ~]# prtstat 1035
Process: httpd         		State: S (sleeping)
  CPU#:  0  		TTY: 0:0	Threads: 1
Process, Group and Session IDs
  Process ID: 1035		  Parent ID: 1
    Group ID: 1035		 Session ID: 1035
  T Group ID: -1

Page Faults
  This Process    (minor major):     2199        50
  Child Processes (minor major):        0         0
CPU Times
  This Process    (user system guest blkio):   0.05   1.73   0.00   0.02
  Child processes (user system guest):         0.00   0.00   0.00
Memory
  Vsize:       235 MB
  RSS:         5353 kB    		 RSS Limit: 18446744073709 MB
  Code Start:  0x557f4e467000		 Code Stop:  0x557f4e4e04a4
  Stack Start: 0x7ffef7c39850
  Stack Pointer (ESP): 0x7ffef7c394a8	 Inst Pointer (EIP): 0x7f3818ed6b23
Scheduling
  Policy: normal
  Nice:   0 		 RT Priority: 0 (non RT)

[root@centos79 ~]# prtstat -r 1035
         pid: 1035           	                  comm: httpd
       state: S              	                  ppid: 1
        pgrp: 1035           	               session: 1035
      tty_nr: 0              	                 tpgid: -1
       flags: 40402100       	                minflt: 2199
     cminflt: 0              	                majflt: 50
     cmajflt: 0              	                 utime: 5
       stime: 173            	                cutime: 0
      cstime: 0              	              priority: 20
        nice: 0              	           num_threads: 1
 itrealvalue: 0              	             starttime: 360
       vsize: 235970560      	                   rss: 1307
      rsslim: 18446744073709551615	             startcode: 94005262446592
     endcode: 94005262943396 	            startstack: 140733055211600
     kstkesp: 7FFEF7C394A8   	               kstkeip: 7F3818ED6B23
       wchan: 18446744072273411893	                 nswap: 0
      cnswap: 18446744072273411893	           exit_signal: 17
   processor: 0              	           rt_priority: 0
      policy: 0              	 delayaccr_blkio_ticks: 2
  guest_time: 0              	           cguest_time: 0
4、设置和调整进程优先级
- 静态优先级:100-139
- 进程默认启动时的nice值为0,优先级为120
- 只有根用户才能降低nice值(提高优先性)
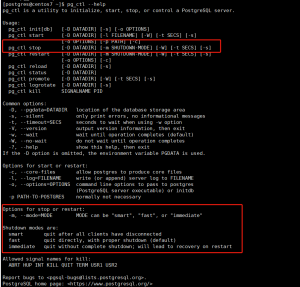
nice命令
以指定的优先级来启动进程
nice [OPTION] [COMMAND [ARG]...]

-n, --adjustment=N   add integer N to the niceness (default 10)
renice命令
可以调整正在执行中的进程的优先级
renice [-n] priority pid...
#范例
[root@centos79 ~]# nice -n -10 ping 127.0.0.1
[root@centos79 ~]# ps axo pid,cmd,nice |grep ping
  3502 ping 127.0.0.1              -10
  3540 grep --color=auto ping        0

[root@centos79 ~]# renice -n -20 3502
3502 (process ID) old priority -10, new priority -20
[root@centos79 ~]# ps axo pid,cmd,nice |grep ping
  3502 ping 127.0.0.1              -20
  3543 grep --color=auto ping        0
5、搜索进程
按条件搜索进程
- ps 选项 | grep ‘pattern’ 灵活
- pgrep 按预定义的模式
- /sbin/pidof 按确切的程序名称查看pid
# pgrep
pgrep [options] pattern

-u uid: effective user,生效者
-U uid: real user,真正发起运行命令者
-t terminal: 与指定终端相关的进程
-l: 显示进程名
-a: 显示完整格式的进程名
-P pid: 显示指定进程的子进程
# pidof
pidof [options] [program [...]]
-x 按脚本名称查找pid
6、负载查询 uptime
- /proc/uptime 包括两个值,单位 s
- 系统启动时长
- 空闲进程的总时长(按总的CPU核数计算)
- uptime 和 w 显示以下内容
- 当前时间
- 系统已启动的时间
- 当前上线人数
- 系统平均负载(1、5、15分钟的平均负载,一般不会超过1,超过5时建议警报)
系统平均负载:指在特定时间间隔内运行队列中的平均进程数,通常每个CPU内核的当前活动进程数不大于3,那么系统的性能良好。如果每个CPU内核的任务数大于5,那么此主机的性能有严重问题。
如:linux主机是1个双核CPU,当Load Average 为6的时候说明机器已经被充分使用
[root@centos79 ~]# uptime
 01:09:37 up 11:01,  3 users,  load average: 0.00, 0.01, 0.05
7、显示CPU相关统计 mpstat
来自于sysstat包
[root@centos79 ~]# yum install -y sysstat

[root@centos79 ~]# mpstat
Linux 3.10.0-1160.el7.x86_64 (centos79) 	11/13/2022 	_x86_64_	(2 CPU)

01:12:26 AM  CPU    %usr   %nice    %sys %iowait    %irq   %soft  %steal  %guest  %gnice   %idle
01:12:26 AM  all    0.01    0.00    0.04    0.00    0.00    0.00    0.00    0.00    0.00   99.95

[root@centos79 ~]# mpstat 1 3
Linux 3.10.0-1160.el7.x86_64 (centos79) 	11/13/2022 	_x86_64_	(2 CPU)

01:12:45 AM  CPU    %usr   %nice    %sys %iowait    %irq   %soft  %steal  %guest  %gnice   %idle
01:12:46 AM  all    0.00    0.00    0.00    0.00    0.00    0.00    0.00    0.00    0.00  100.00
01:12:47 AM  all    0.00    0.00    0.50    0.00    0.00    0.00    0.00    0.00    0.00   99.50
01:12:48 AM  all    0.00    0.00    0.00    0.00    0.00    0.00    0.00    0.00    0.00  100.00
Average:     all    0.00    0.00    0.17    0.00    0.00    0.00    0.00    0.00    0.00   99.83
8、查看进程实时状态 top 和 htop
8.1、top
![图片[3]-进程管理和性能相关工具1-李佳程的个人主页](http://www.lijiach.com/wp-content/uploads/2022/11/image-65.png)
![图片[4]-进程管理和性能相关工具1-李佳程的个人主页](http://www.lijiach.com/wp-content/uploads/2022/11/image-66.png)
#top 提供动态的实时进程状态
#内置命令
帮助:h 或 ? ,按 q 或esc 退出帮助

排序:
P:以占据的CPU百分比,%CPU
M:占据内存百分比,%MEM
T:累积占据CPU时长,TIME+

首部信息显示:
uptime信息:l命令
tasks及cpu信息:t命令
cpu分别显示:1 (数字)
memory信息:m命令

退出命令:q
修改刷新时间间隔:s
终止指定进程:k
保存文件:W
#top命令栏位信息
us:用户空间
sy:内核空间
ni:调整nice时间
id:空闲
wa:等待IO时间
hi:硬中断
si:软中断(模式切换)
st:虚拟机偷走的时间
#选项
-d #    指定刷新时间间隔,默认为3秒
-b      全部显示所有进程
-n #    刷新多少次后退出
-H      线程模式
8.2、htop
htop 命令是增强版的TOP命令,来自EPEL源,比top功能更强
#选项
-d #: 指定延迟时间;
-u UserName: 仅显示指定用户的进程
-s COLUME: 以指定字段进行排序
#子命令
s:跟踪选定进程的系统调用
l:显示选定进程打开的文件列表
a:将选定的进程绑定至某指定CPU核心
t:显示进程树[root@centos79 ~]# yum install -y htop![图片[5]-进程管理和性能相关工具1-李佳程的个人主页](http://www.lijiach.com/wp-content/uploads/2022/11/image-67.png)
9、内存空间 free
![图片[6]-进程管理和性能相关工具1-李佳程的个人主页](http://www.lijiach.com/wp-content/uploads/2022/11/image-69.png)
free 可以显示内存空间使用状态
free [OPTION]-b 以字节为单位
-m 以MB为单位
-g 以GB为单位
-h 易读格式
-o 不显示-/+buffers/cache行
-t 显示RAM + swap的总和
-s n 刷新间隔为n秒
-c n 刷新n次后即退出
向/proc/sys/vm/drop_caches中写入相应的修改值,会清理缓存。建议先执行sync(sync 命令将所有未写的系统缓冲区写到磁盘中,包含已修改的 i-node、已延迟的块 I/O 和读写映射文件)。执行echo 1、2、3 至 /proc/sys/vm/drop_caches, 达到不同的清理目的。
如果因为是应用有像内存泄露、溢出的问题时,从swap的使用情况是可以比较快速可以判断的,但通过执行free 反而比较难查看。但核心并不会因为内存泄露等问题并没有快速清空buffer或cache(默认值是0),生产也不应该随便去改变此值。
一般情况下,应用在系统上稳定运行了,free值也会保持在一个稳定值的。当发生内存不足、应用获取不到可用内存、OOM错误等问题时,还是更应该去分析应用方面的原因,否则,清空buffer,强制腾出
free的大小,可能只是把问题给暂时屏蔽了。
排除内存不足的情况外,除非是在软件开发阶段,需要临时清掉buffer,以判断应用的内存使用情况;或应用已经不再提供支持,即使应用对内存的时候确实有问题,而且无法避免的情况下,才考虑定时清空buffer。
![图片[7]-进程管理和性能相关工具1-李佳程的个人主页](http://www.lijiach.com/wp-content/uploads/2022/11/image-68.png)
available:可用内存容量
10、进程对应的内存映射 pmap
pmap [options] pid [...]

-x: 显示详细格式的信息
11、虚拟内存信息 vmstat
vmstat [options] [delay [count]]

-s 显示内存的统计数据
#显示项
procs:
  r:可运行(正运行或等待运行)进程的个数,和核心数有关
  b:处于不可中断睡眠态的进程个数(被阻塞的队列的长度)
memory:
  swpd: 交换内存的使用总量
  free:空闲物理内存总量
  buffer:用于buffer的内存总量
  cache:用于cache的内存总量
swap:
  si:从磁盘交换进内存的数据速率(kb/s)
  so:从内存交换至磁盘的数据速率(kb/s)
io:
  bi:从块设备读入数据到系统的速率(kb/s)
  bo: 保存数据至块设备的速率
system:
  in: interrupts 中断速率,包括时钟
  cs: context switch     进程切换速率
cpu:
  us: Time spent running non-kernel code
  sy: Time spent running kernel code
  id: Time spent idle. Linux 2.5.41前,包括IO-wait time.
  wa: Time spent waiting for IO.  2.5.41前,包括in idle.
  st: Time stolen from a virtual machine.  2.6.11前, unknown.
[root@centos79 ~]# vmstat
procs -----------memory---------- ---swap-- -----io---- -system-- ------cpu-----
 r  b   swpd   free   buff  cache   si   so    bi    bo   in   cs us sy id wa st
 1  0      0 3266556   2108 321492    0    0     4     0   26   46  0  0 100  0  0

[root@centos79 ~]# vmstat  1 3
procs -----------memory---------- ---swap-- -----io---- -system-- ------cpu-----
 r  b   swpd   free   buff  cache   si   so    bi    bo   in   cs us sy id wa st
 1  0      0 3266556   2108 321524    0    0     4     0   26   46  0  0 100  0  0
 0  0      0 3266556   2108 321524    0    0     0     0   69  105  0  1 100  0  0
 0  0      0 3266556   2108 321524    0    0     0     0   55   90  0  0 100  0  0


[root@centos79 ~]# vmstat  -s
      3861288 K total memory
       270952 K used memory
       214476 K active memory
       117464 K inactive memory
      3266704 K free memory
         2108 K buffer memory
       321524 K swap cache
      2097148 K total swap
            0 K used swap
      2097148 K free swap
          862 non-nice user cpu ticks
            0 nice user cpu ticks
         3307 system cpu ticks
      8253844 idle cpu ticks
          128 IO-wait cpu ticks
            0 IRQ cpu ticks
          167 softirq cpu ticks
            0 stolen cpu ticks
       308654 pages paged in
        38066 pages paged out
            0 pages swapped in
            0 pages swapped out
      2137890 interrupts
      3804451 CPU context switches
   1668233315 boot time
         3740 forks
12、统计CPU和设备IO信息 iostat
iostat 可以提供更丰富的IO性能状态数据
此工具由sysstat包提供
常用选项:
-c 只显示CPU行
-d 显示设备〈磁盘)使用状态
-k 以千字节为为单位显示输出
-t 在输出中包括时间戳
-x 在输出中包括扩展的磁盘指标
[root@centos79 ~]# iostat
Linux 3.10.0-1160.el7.x86_64 (centos79) 	11/13/2022 	_x86_64_	(2 CPU)

avg-cpu:  %user   %nice %system %iowait  %steal   %idle
           0.01    0.00    0.04    0.00    0.00   99.95

Device:            tps    kB_read/s    kB_wrtn/s    kB_read    kB_wrtn
scd0              0.00         0.02         0.00       1028          0
sdb               0.02         0.35         0.05      14581       2101
sdc               0.01         0.13         0.00       5244         32
sda               0.30         6.94         0.87     287800      35976
dm-0              0.28         6.17         0.82     255866      33928
dm-1              0.00         0.05         0.00       2204          0
dm-2              0.02         0.31         0.05      12969       2133
[root@centos79 ~]# iostat 1 3
Linux 3.10.0-1160.el7.x86_64 (centos79) 11/13/2022 _x86_64_ (2 CPU)
avg-cpu: %user %nice %system %iowait %steal %idle
0.01 0.00 0.04 0.00 0.00 99.95
Device: tps kB_read/s kB_wrtn/s kB_read kB_wrtn
scd0 0.00 0.02 0.00 1028 0
sdb 0.02 0.35 0.05 14581 2101
sdc 0.01 0.13 0.00 5244 32
sda 0.30 6.94 0.87 287800 35976
dm-0 0.28 6.17 0.82 255866 33928
dm-1 0.00 0.05 0.00 2204 0
dm-2 0.02 0.31 0.05 12969 2133
avg-cpu: %user %nice %system %iowait %steal %idle
0.00 0.00 0.00 0.00 0.00 100.00
Device: tps kB_read/s kB_wrtn/s kB_read kB_wrtn
scd0 0.00 0.00 0.00 0 0
sdb 0.00 0.00 0.00 0 0
sdc 0.00 0.00 0.00 0 0
sda 1.00 0.00 1.50 0 1
dm-0 1.00 0.00 1.50 0 1
dm-1 0.00 0.00 0.00 0 0
dm-2 0.00 0.00 0.00 0 0
avg-cpu: %user %nice %system %iowait %steal %idle
0.00 0.00 0.00 0.00 0.00 100.00
Device: tps kB_read/s kB_wrtn/s kB_read kB_wrtn
scd0 0.00 0.00 0.00 0 0
sdb 0.00 0.00 0.00 0 0
sdc 0.00 0.00 0.00 0 0
sda 0.00 0.00 0.00 0 0
dm-0 0.00 0.00 0.00 0 0
dm-1 0.00 0.00 0.00 0 0
dm-2 0.00 0.00 0.00 0 0tps:该设备每秒的传输次数(Indicate the number of transfers per second that were issued to the device.)。"一次传输"意思是"一次I/O请求"。多个逻辑请求可能会被合并为"一次I/O请求"。"一次传输"请求的大小是未知的。
kB_read/s:每秒从设备(drive expressed)读取的数据量;
kB_wrtn/s:每秒向设备(drive expressed)写入的数据量;
kB_read:读取的总数据量;
kB_wrtn:写入的总数量数据量;这些单位都为Kilobytes。
1 bit = 0.125 bytes
1 byte = 8 bits
1 KB (kilobytes) = 1024 bytes
1 MB (Megabytes) = 1024 KB (kilobytes)
[root@centos79 ~]# iostat -d sda -t -k 1 3
Linux 3.10.0-1160.el7.x86_64 (centos79) 	11/13/2022 	_x86_64_	(2 CPU)

11/13/2022 01:42:54 AM
Device:            tps    kB_read/s    kB_wrtn/s    kB_read    kB_wrtn
sda               0.30         6.91         0.87     287800      36139

11/13/2022 01:42:55 AM
Device:            tps    kB_read/s    kB_wrtn/s    kB_read    kB_wrtn
sda               0.00         0.00         0.00          0          0

11/13/2022 01:42:56 AM
Device:            tps    kB_read/s    kB_wrtn/s    kB_read    kB_wrtn
sda               0.00         0.00         0.00          0          0
[root@centos79 ~]# iostat -d sda 1 3 -x
Linux 3.10.0-1160.el7.x86_64 (centos79) 11/13/2022 _x86_64_ (2 CPU)
Device: rrqm/s wrqm/s r/s w/s rkB/s wkB/s avgrq-sz avgqu-sz await r_await w_await svctm %util
sda 0.00 0.01 0.16 0.15 6.90 0.87 51.39 0.00 0.48 0.40 0.56 0.23 0.01
Device: rrqm/s wrqm/s r/s w/s rkB/s wkB/s avgrq-sz avgqu-sz await r_await w_await svctm %util
sda 0.00 0.00 0.00 0.00 0.00 0.00 0.00 0.00 0.00 0.00 0.00 0.00 0.00
Device: rrqm/s wrqm/s r/s w/s rkB/s wkB/s avgrq-sz avgqu-sz await r_await w_await svctm %util
sda 0.00 0.00 0.00 0.00 0.00 0.00 0.00 0.00 0.00 0.00 0.00 0.00 0.00
#输出说明
r/s: 每秒合并后读的请求数
w/s: 每秒合并后写的请求数
rsec/s:每秒读取的扇区数;
wsec/:每秒写入的扇区数。
rKB/s:The number of read requests that were issued to the device per second;
wKB/s:The number of write requests that were issued to the device per second;
rrqm/s:每秒这个设备相关的读取请求有多少被Merge了(当系统调用需要读取数据的时候,VFS将请求发到各个FS,如果FS发现不同的读取请求读取的是相同Block的数据,FS会将这个请求合并Merge);
wrqm/s:每秒这个设备相关的写入请求有多少被Merge了。
%rrqm: 读请求在发送到设备前合并在一起的百分比。
%wrqm: 写请求在发送到设备前合并在一起的百分比。
avgrq-sz 平均请求扇区的大小
avgqu-sz 是平均请求队列的长度。毫无疑问,队列长度越短越好。
await: 每一个IO请求的处理的平均时间(单位是微秒毫秒)。这里可以理解为IO的响应时间,一般地系统IO响应时间应该低于5ms,如果大于10ms就比较大了。这个时间包括了队列时间和服务时间,也就是说,一般情况下,await大于svctm,它们的差值越小,则说明队列时间越短,反之差值越大,队列时间越长,说明系统出了问题。
svctm 表示平均每次设备I/O操作的服务时间(以毫秒为单位)。如果svctm的值与await很接近,表示几乎没有I/O等待,磁盘性能很好,如果await的值远高于svctm的值,则表示I/O队列等待太长,系统上运行的应用程序将变慢。
%util: 在统计时间内所有处理IO时间,除以总共统计时间。例如,如果统计间隔1秒,该设备有0.8秒在处理IO,而0.2秒闲置,那么该设备的%util = 0.8/1 = 80%,所以该参数暗示了设备的繁忙程度。一般地,如果该参数是100%表示设备已经接近满负荷运行了(当然如果是多磁盘,即使%util是100%,因为磁盘的并发能力,所以磁盘使用未必就到了瓶颈)。